Dashboards
|
1 Answer |
Tracking Guide Authoring/Editing Time |
|
0 Replies |
Is There A Uploaded Document Report?Discussion Topic |
|
0 Answers |
How can I view all incomplete courses for employees? |
|
1 Answer |
How can I monitor my site usage? |

To view and export the data you have collected using the Timing & Data Capture Feature, visit the Reports section in your Management Console navigation menu to view several options for reporting.

Guide View History gives a quick look into activity by user and by guide. Admins can search for users and guides or use the timeframe toggles to view Today, 7 days, or 30 days of activity.


Timing and Data Capture allow you to download data reports about guides with the Data Capture feature activated.
These data reports include the work order number that was entered, the user’s name, the cycle time of the entire procedure, the individual step cycle time, and any data collected from prompts on a guide.

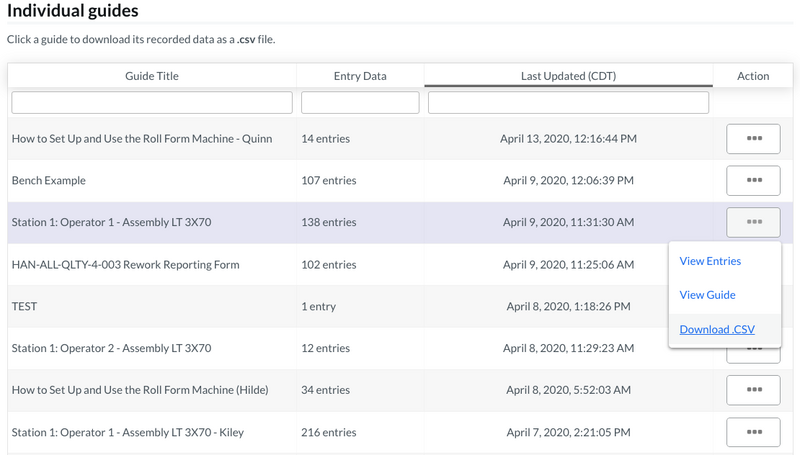
To view the individual entries made for a guide, click on the Action button and select View Entries.

You can view a list of each of the work sessions for this guide, ordered by date. Additionally, click the '''View as .PDF"' for a PDF report of that work session's data.

You can also download a .CSV file that displays all of the entries ever made to a single guide. You may view, sort, compare, and manipulate the data and timing information. Using Microsoft Excel or similar programs, this is the data that you collect from Operator View. You can even export this information into other programs.
To download the file, click the Download .CSV link on the Reports page for the guide report that you want to view.

Keep in mind that the .CSV file is exported in its raw format. You can apply any formatting styles or sorting rules to the columns, rows, and cells once you download the file.

With dashboards, you can view combined metrics from your workstations and work orders.
Dozuki dashboards include filters that allow you to refine the data displayed within the dashboard.

For demonstration purposes, below you may view five common filters:
1 . Author

2. Approvers

3. Guide

4. Category

5. Approval Status

Note: We can customize your filters to meet your reporting needs.
Each dashboard has a default date range that you can adjust.
This range can be changed using the range filter in the top-right corner of the screen.

The current standard dashboard options include: Process Status, Work Order History, and Factory View.
Take a deeper look at process-specific (guide-specific) metrics including: step-level time distribution, fastest user, slowest user, and more.

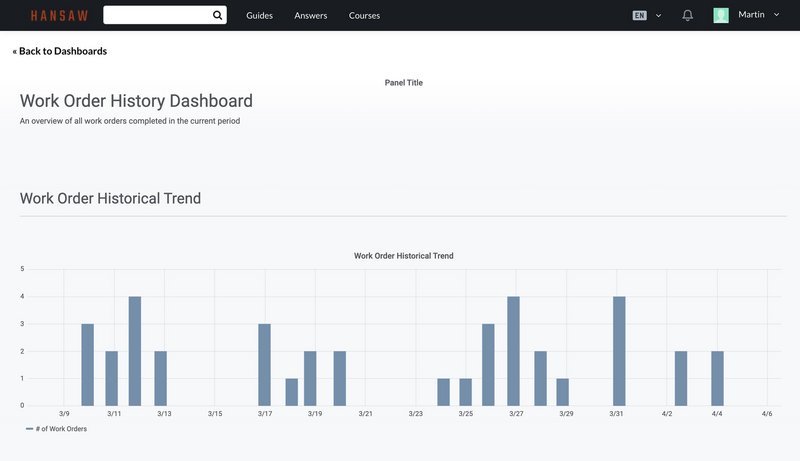
View an overview of your work order output. Identify trends in your throughput performance and view detailed work order logs.

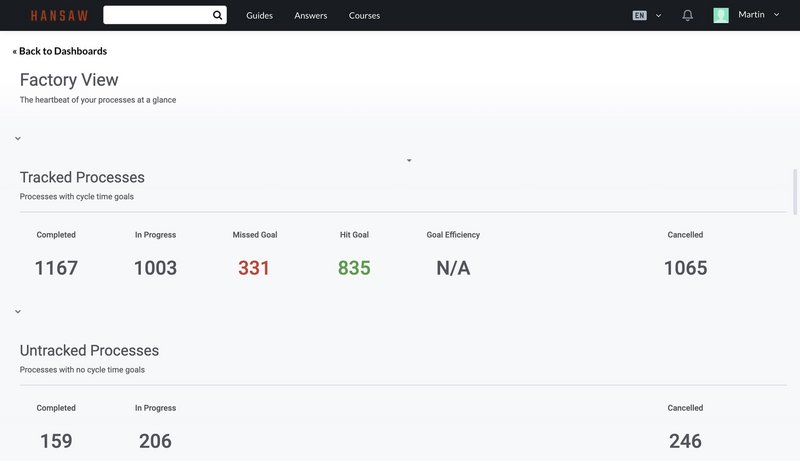
Factory View Dashboards provide a general overview of the site; it shows a general count of processes filtered by a date range. Factory View allows you to track processes which are in work logs with Operator View. It also includes untracked processes, goal hits, average cycle times, and work log details.

This dashboard provides an overview of who has been trained and on which procedures on your Dozuki site. You can filter by Guide, Category, and Employee. Additionally, the dashboard reports who is trained, out-of-date, and untrained. A user is marked as Current if they have completed the guide in Operator View.


